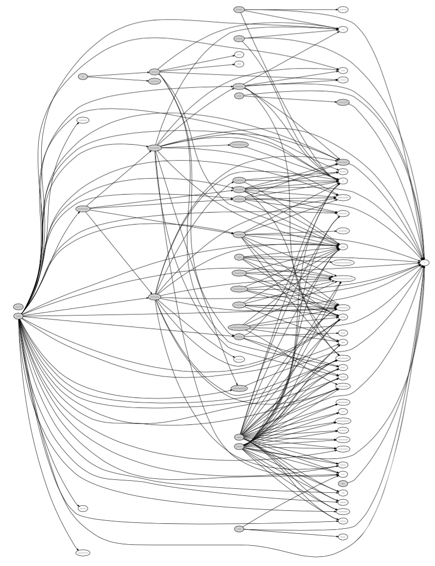
Graphing Python Dependencies with Snakefood
29 Sep 2015When I need to tease out complex dependencies in a python project, I use snakefood.
To install:
brew install graphviz
pip install snakefood
Read more documentation here, but here’s a quick example use:
cd YOUR-PROJECT
sfood . | sfood-graph | dot -Tps | pstopdf -i -o map.pdf
open map.pdf
Which produces a map.pdf that looks like:

(In the PDF you can zoom in and read the labels and pan around the dependency links.)
